Turning data into decisions.

Business Systems Analyst | Data & Operations Analyst

I'm Yash Shimpi. I study how work gets done, document the process, and turn the data into insights teams can act on.

About me
Explore portfolio Hi, I'm Yash!

Illustration with sample data: one request moving from intake to approval to reporting. Move across the panels to bring it into focus.

I enjoy understanding business requirements, analyzing workflows and translating data into actionable insights.

Background

I'm a business systems and process analyst with a background spanning:

  • Business analysis
  • Operations
  • Reporting
  • Digital marketing
  • Project coordination

Workflow management

I've worked with Adobe Workfront for:

  • Project and task tracking
  • Reports and dashboards
  • Request queues
  • Approvals

I use existing workflows to support work visibility, request tracking, approvals and operational coordination.

Open to

  • Business Systems Analyst
  • Adobe Workfront Analyst
  • Business Process Analyst
  • Operations Analyst
  • Data Analyst

Let's connect

I'm always interested in connecting with professionals working in enterprise applications, business process improvement, analytics and workflow management.

Education

A foundation in information technology and a master's focused on information science.

Master's / Aug 2024 to May 2026

M.S. in Information Science

Cleveland State University

3.8GPA out of 4.0

Academic exposure to:

  • Information systems
  • Data analytics
  • Database management
  • Software engineering
  • Cloud computing
  • IT project management

Bachelor's

Bachelor's in Information Technology

Sinhgad Institute of Technology & Science

AGrade

Key subjects:

  • Machine learning
  • Cloud computing
  • Database management
  • Deep learning
  • Business analysis
  • Project management

Work Experience

Feb 2024 to Apr 2026 ยท 2 yrs 3 mos

Digital Media Analyst

Shorelight

Cleveland, Ohio, United States

  • Adobe Workfront
  • Power BI
  • Tableau
  • Python
10โ€“15%estimated engagement lift
~30%less manual reporting time
20โ€“30work requests tracked and approved per month
5โ€“8recurring Power BI and Tableau reports
  • Analyzed weekly performance metrics across Instagram, LinkedIn, and Facebook to identify trends, supporting an estimated 10โ€“15% engagement lift.
  • Tracked and approved 20โ€“30 work requests per month in Adobe Workfront, giving stakeholders progress visibility through dashboards.
  • Developed 5โ€“8 recurring Power BI and Tableau reports and dashboards to communicate findings and recommendations.
  • Built Python scripts to automate data collection and reporting, reducing manual reporting time by approximately 30% (about 4โ€“5 hours per week).
  • Used audience and engagement data to inform content strategy and recommendations for 4โ€“6 marketing stakeholders.

Dec 2023 to Jun 2024 ยท 7 mos

System Analyst

Accenture ยท Full-time

India ยท On-site

  • Adobe Workfront
8โ€“10projects tracked in Adobe Workfront
30โ€“40business requests tracked per month
~10%estimated improvement in on-time task completion
10โ€“15%estimated reduction in approval delays
  • Tracked tasks, assignments, deadlines, milestones, and deliverables across 8โ€“10 projects in Adobe Workfront.
  • Monitored project progress and task status to identify overdue activities, pending deliverables, and bottlenecks, improving on-time task completion by an estimated 10%.
  • Reviewed Workfront reports and dashboards covering 6โ€“8 operational metrics to give stakeholders clear project visibility.
  • Tracked 30โ€“40 business requests per month through Workfront request queues, maintaining accurate details and statuses.
  • Monitored approval processes and coordinated follow-ups on pending approvals, reducing approval delays by an estimated 10โ€“15%.
  • Reviewed project and task data weekly to correct inconsistencies and maintain reliable operational records.
  • Worked with 6โ€“8 business users and project stakeholders to clarify requirements, resolve tracking issues, and follow established processes.
  • Used Workfront tracking and reporting to support workflow visibility, coordination, and accountability.


Additional Experience

Jan 2025 to May 2026

Campus Ambassador

Cleveland State University

Cleveland, OH

  • Adobe Creative Suite
  • Analyzed engagement and attendance data to guide outreach campaign targeting, increasing prospective student engagement and event turnout.
  • Coordinated cross-departmental event promotion, using performance data to refine messaging and timing for maximum reach.
  • Produced on-brand marketing assets (graphics, video, copy) in Adobe Creative Suite to support data-informed campaign strategies.

2023 to 2024

Marketing & Branding Specialist

O'RANGE Innovations

Remote

  • Analyzed campaign performance and audience data to optimize social content calendars, posting schedules, and channel mix.
  • Designed integrated marketing campaigns across email, social, and digital advertising, guided by competitive and audience research.
  • Conducted competitive landscape analysis to inform data-backed targeting and messaging strategy.

2022 to 2023

Outreach & Marketing Coordinator

IMUN (International Model United Nations)

Remote

  • Used multi-channel performance data to guide delegate outreach strategy, growing event participation across email, social, and partnerships.
  • Designed promotional materials and visual assets for international conferences, strengthening global brand presence.

Projects

Project Leader / Team of five

Journey Hive

Database Management System

  • Microsoft Access
  • C#
  • Visual Studio
  • ERD Modeling
  • SQL
  • Data Modeling

Journey Hive is an interstate transportation management system designed to streamline bus ticket booking, route management and passenger services. It addresses major industry challenges: limited travel slots, fragmented ticketing platforms and inefficient data management.

As Project Leader, I guided a team of five through the full SDLC: requirements gathering, analysis, database modeling, system design, front-end integration, testing and deployment.

The project integrates a relational database built in Microsoft Access with a C# application interface, enabling real-time booking, a personalized passenger experience, secure data handling and operational efficiency.

Project roadmap
Project Initiation and Planning Requirements gathering Analysis Design Phase Conceptual, logical and physical models ER diagrams, normalization and business rules UI wireframes and field specifications Development Phase Multi-table relational database C# front-end prototype Microsoft Access integration Data governance and referential integrity Testing and Final Adjustments Load, stress and endurance testing Query performance testing Recovery testing Deployment Preparation Documentation Final deployment package Journey Hive DBMS
  1. Project Initiation and Planning
    • Requirements gathering
    • Analysis
  2. Design Phase
    • Conceptual, logical and physical models
    • ER diagrams, normalization and business rules
    • UI wireframes and field specifications
  3. Development Phase
    • Multi-table relational database
    • C# front-end prototype
    • Microsoft Access integration
    • Data governance and referential integrity
  4. Testing and Final Adjustments
    • Load, stress and endurance testing
    • Query performance testing
    • Recovery testing
  5. Deployment Preparation
    • Documentation
    • Final deployment package

Key responsibilities

  • Designed complete conceptual, logical and physical database models, including ER diagrams, table structures, normalization and business rules.
  • Built a multi-table relational database for passengers, bookings, benefits, operators, invoices and routes.
  • Developed a C# front-end prototype and integrated it with the Access database.
  • Implemented data governance rules, referential integrity, foreign key constraints and security protocols.
  • Performed load, stress, endurance, query performance and recovery testing.
  • Led preparation of documentation, UI wireframes, field specifications and the final deployment package.

System features

Smart Route Comparison Engine
Passenger Profile & Personalization
Real-Time Data Integration
Booking, Tickets and Invoicing Module
Journey BenefitsWi-Fi, AC, SOS Button, Snacks, Luggage Storage
Secure Data ArchitectureWith validation tables

IST 663 Machine Learning / Cleveland State University

ML-Based Prediction of Semiconductor Stock Prices

Using Financial & External Factors

  • ARIMA
  • Random Forest
  • XGBoost
  • LSTM
  • SHAP
  • Permutation importance

Developed a multi-modal machine learning framework to predict next-day semiconductor stock returns by integrating financial, technical and macroeconomic data across 25 companies (2020โ€“2026).

Built and evaluated four models on a dataset of 37,990 trading-day records with 123 engineered features per row, including RSI, MACD, Bollinger Bands, moving averages, VIX, CPI, Fed Funds Rate, 10Y Treasury Yield and supply chain indicators (GSCPI).

37,990trading-day records
123engineered features per row
25semiconductor companies
4models built and evaluated
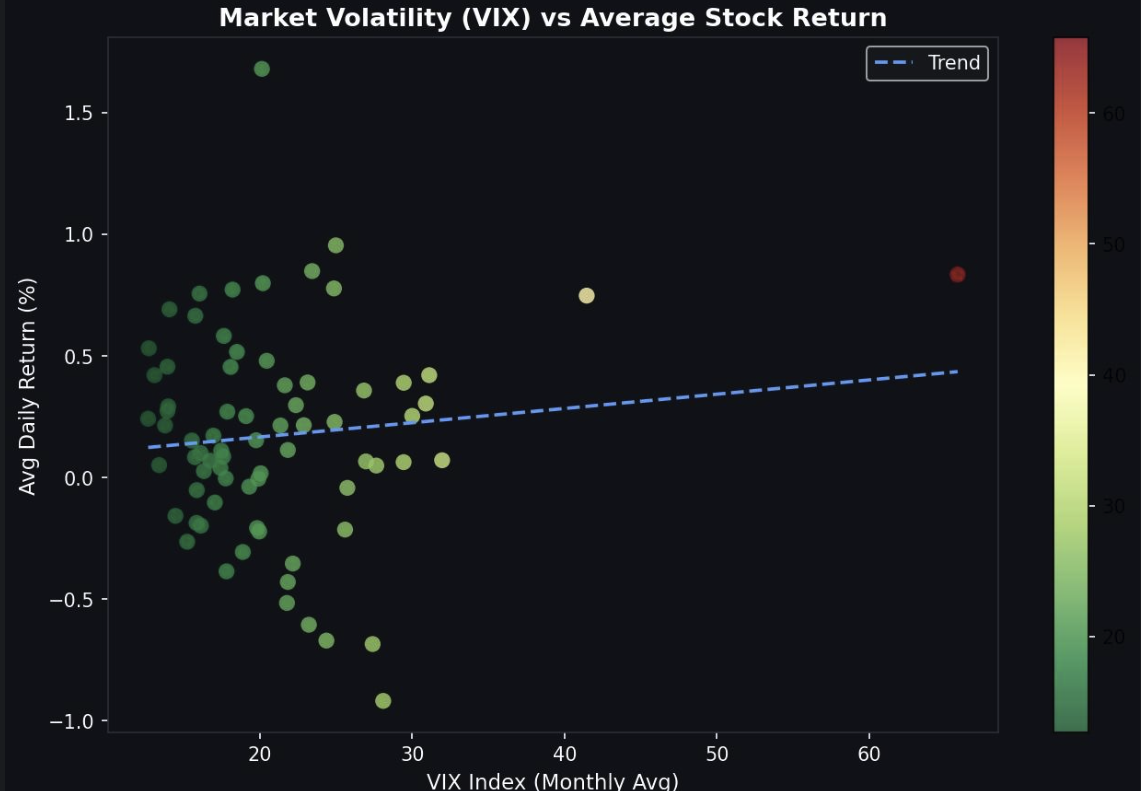
Market volatility vs. average stock return
Scatter chart of the monthly average VIX index against average daily stock return, with a slightly rising dashed trend line.

Dataset overview

Dataset attributeDetails
Total Records37,990 rows
Unique Tickers25 companies
Date Range2020โ€“2026
Total Features123 columns
Technical IndicatorsRSI, MACD, Bollinger, MAs
Macro VariablesVIX, CPI, Fed Rate, Yield Curve
Trend LabelsBullish / Bearish / Neutral

Models compared

ARIMABaseline
Random ForestEvaluated against the baseline
XGBoostLowest prediction error
LSTMBest captured temporal patterns during volatile periods

Key outcomes

  • XGBoost achieved the lowest prediction error.
  • LSTM best captured temporal patterns during volatile periods.
  • Including macroeconomic features significantly reduced error compared with price-only models.
  • Applied SHAP values and permutation importance to identify top predictive drivers across stocks like NVIDIA, AMD, Intel, TSMC and Broadcom.

Semester capstone project

CineLog

Film Diary & Discovery App

  • React 18
  • Node.js
  • Express
  • PostgreSQL
  • JWT
  • TMDb API

A full-stack web application for tracking films, writing reviews and discovering new movies, built with React 18, Node.js, Express and PostgreSQL.

Sign-in and landing page
My Film Diary
๐ŸŽฌ CineLogDashboardMy DiaryDiscoveryash_02 Logout
My Film Diary+ Log a Film
TitleGenreMin โ˜…Max โ˜…FilterClear
FilmYearGenreRatingWatchedReviewActions
Schindler's List1993History4.0 โ˜…5/7/2026โ€”EditDelete
Fight Club1999Drama5.0 โ˜…5/7/2026โ€”EditDelete
Interstellar2014Sci-Fi3.0 โ˜…5/7/2026โ€”EditDelete

Features

JWT authentication
Full CRUD film diaryWith search and filter
Personal stats dashboardPowered by SQL aggregates
Community discovery pageUsing relational subqueries
TMDb API integrationReal movie poster artwork

Certifications

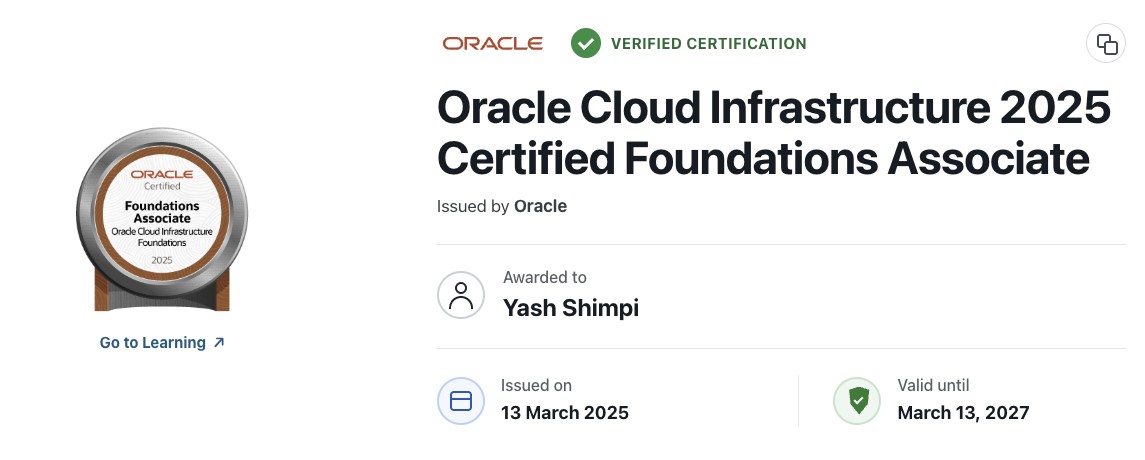
Oracle Cloud Infrastructure 2025 Certified Foundations Associate certification from Oracle, awarded to Yash Shimpi.

Issued 13 March 2025 / Valid until 13 March 2027

Oracle Cloud Infrastructure 2025 Certified Foundations Associate

Oracle

  • Basic cloud concepts
  • Core OCI services
  • Security, identity and compliance
  • Billing and cost management
  • Governance and administration
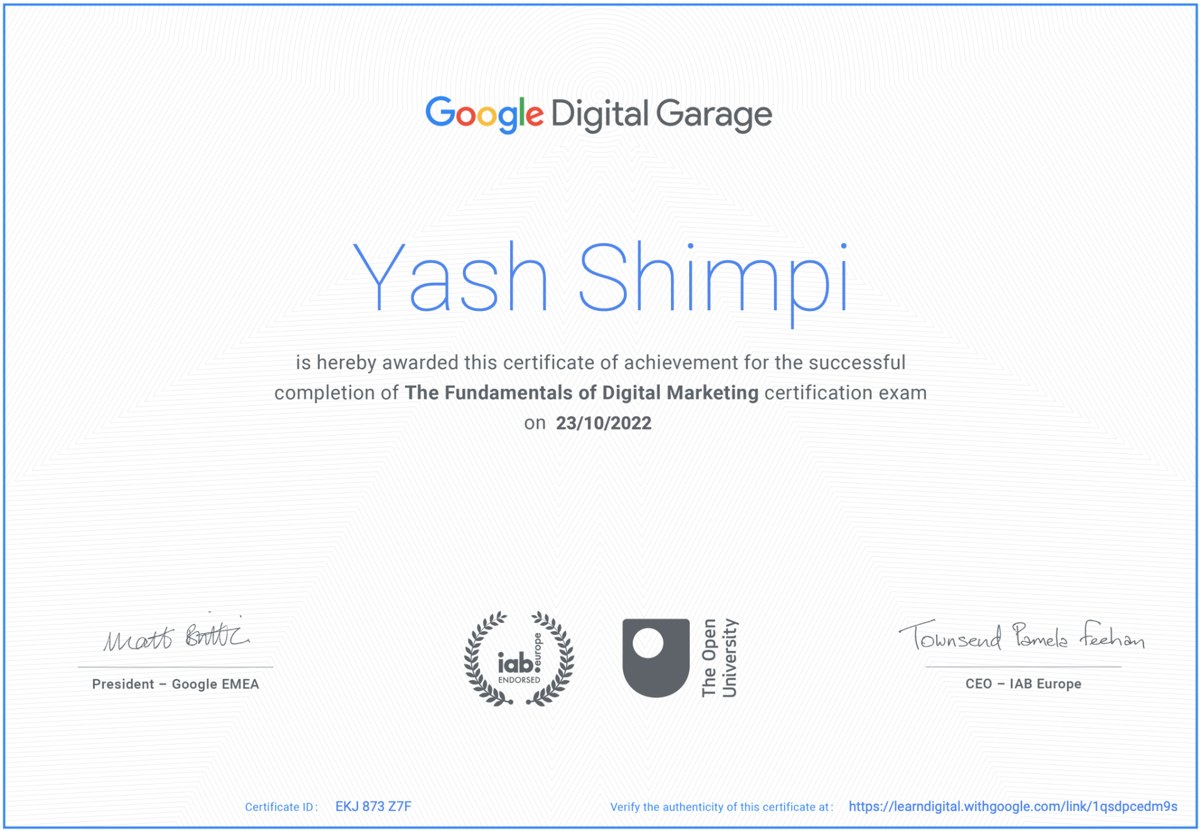
Google Digital Garage certificate of achievement for The Fundamentals of Digital Marketing, awarded to Yash Shimpi.

Completed 23 October 2022

The Fundamentals of Digital Marketing

Google Digital Garage

  • IAB Europe endorsed
  • The Open University
Certificate ID: EKJ 873 Z7FVerify certificate
Coding Ninjas Certificate of Excellence for Introduction to JAVA, awarded to Yash Gulab Shimpi as a top performer.

July 2022 to September 2022

Introduction to JAVA

Coding Ninjas

  • Certificate of Excellence
  • Top Performer

Research Papers

Research paper

ORGO: Organ Donation Application Using Android

Yash Shimpi, Piyush Jadhav, Nikita Wable. Guided by Prof. Wasudeo P. Rahane and Prof. Mrs. M.S. Kurhade. Department of Information Technology Engineering, NBNSTIC, Pune, India.

Proposes an Android application that connects organ donors, recipients and doctors, matching donors and recipients on factors such as blood type, organ compatibility and geographic proximity, with admin controls for managing doctors and donors.

Proposed features

  • Donor registration
  • Digital donation card
  • Emergency contact
  • Organ donation education
  • Push notifications
  • Android Studio
  • Mobile application design
  • Healthcare technology

Final project / Fall 2025

Telco Customer Churn: From Analysis to Retention Strategy

IST 615 Business Intelligence Systems, Cleveland State University. Instructor: Dr. Oguz.

Combines descriptive analysis, logistic regression and prescriptive recommendations to find why telecom customers leave. Month-to-month contracts, electronic check payments and short tenure emerged as key churn drivers, while added support services were linked to lower churn.

7,043customer records
~80%model accuracy
0.83AUC

Recommended actions

  • Incentives for longer contracts
  • Better payment experience
  • Value-added service bundles
  • Proactive churn monitoring
  • Python
  • pandas
  • scikit-learn
  • Logistic regression

Course assignment / Fall 2025

Prescriptive Analytics Using Linear Programming

IST 615 Business Intelligence Systems, Cleveland State University.

Builds a linear programming model to find the production plan that maximizes profit across ten products and five limited resources, then uses slack analysis to identify the bottleneck and recommend what management should do next.

$7,875optimal profit
225units of P5
0energy slack

Findings

  • Optimal plan: 225 units of product P5
  • Energy is the binding resource, with zero slack
  • Other resources still have spare capacity
  • Linear programming
  • Slack analysis
  • Bottleneck analysis

Course research / January 2025

Digital Twin of a Customer: Understanding the Gartner Hype Cycle

IST 616 Emerging Tech Information Systems, Cleveland State University.

Examines the Digital Twin of a Customer, a data-driven virtual model of customer behavior, through the five stages of the Gartner Hype Cycle, including its enabling technologies, uses, challenges and social and economic impact.

Areas explored

  • Use cases in retail, healthcare and banking
  • Privacy, data security and compliance
  • Implementation cost and integration complexity
  • Gartner Hype Cycle
  • AI and data analytics
  • IoT
  • Cloud computing

Skills

Industry Knowledge

Tools & Technologies

Interpersonal Skills

Languages

My Skills

Where I used it

Python

  • Cleveland State University
  • ML-Based Prediction of Semiconductor Stock Prices
  • Digital Media Analyst at Shorelight

Contact me

Let's connect.

Hiring for a business systems, process, operations or data analyst role? I'd like to hear from you. I also enjoy connecting with professionals in enterprise applications, process improvement, analytics and workflow management.

Emailsyasha7074@gmail.com
Phone(216) 612-2472
LinkedInyash-shimpi-7a4842250
Say hi!
ยฉ 2026 Yash ShimpiBack to top โ†‘